Table
Factors for Calculating Three- Sigma Limits for the - chart and - chart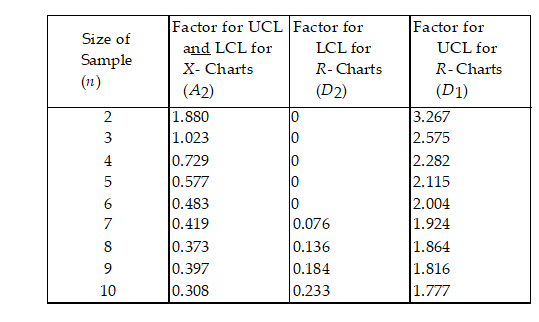
-A milling operation has historically produced an average thickness of 0.005 inch with an average range of 0.0015 inch. Currently, the first three items from each batch of 20 are inspected.
Use Table 1.. What is the value of LCL ) if the sample size is increased to 6?
A) less than or equal to 0.0030
B) greater than 0.0030 but less than or equal to 0.0049
C) greater than 0.0049 but less than or equal to 0.0069
D) greater than 0.0069
Correct Answer:
Verified
Q28: Which one of the following is considered
Q29: Historically, the average proportion of defective bars
Q30: Table 7.1
Factors foe Calculating Thee- Segma
Q31: The upper and lower specification limits for
Q32: The cause- and- effect diagram is a
Q34: Which one of the following statements about
Q35: Consumers consider various aspects when defining quality
Q36: Which alternative will increase the probability of
Q37: Table 7.1 Q38: Which one of the following statements is
Unlock this Answer For Free Now!
View this answer and more for free by performing one of the following actions

Scan the QR code to install the App and get 2 free unlocks

Unlock quizzes for free by uploading documents