Table 7.1
Factors foe Calculating Thee- Segma L.tmits for the -chart and -chart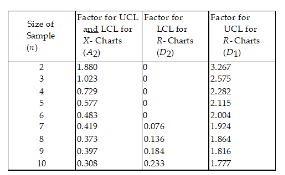
-Historically, the average diameter of the holes drilled has been 0.25 cm and the average range has been 0.1 cm. Determine the central line and upper and lower control limits for an and an R- chart, assuming samples of size 8 will be taken. Use Table 7.1. For the R- chart, what is the value of the UCLR ?
A) less than or equal to 0.1000
B) greater than 0.1000 but less than or equal to 0.1510
C) greater than 0.1510 but less than or equal to 0.2020
D) greater than 0.2020
Correct Answer:
Verified
Q25: A process is said to be in
Q26: A manufacturer of silk inspects each bolt
Q27: Which one of the following statements is
Q28: Which one of the following is considered
Q29: Historically, the average proportion of defective bars
Q31: The upper and lower specification limits for
Q32: The cause- and- effect diagram is a
Q33: Table
Q34: Which one of the following statements about
Q35: Consumers consider various aspects when defining quality
Unlock this Answer For Free Now!
View this answer and more for free by performing one of the following actions

Scan the QR code to install the App and get 2 free unlocks

Unlock quizzes for free by uploading documents