The figure below depicts the supply of U.S. dollars in the foreign currency exchange market. 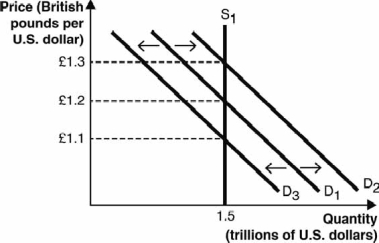 A shift from D1 to D3 in the above figure could have been caused by an)
A) decrease in the exchange rate from £1.2/$1 to £1.1/$1.
B) increase in the exchange rate from £1.1/$1 to £1.2/$1.
C) increase in demand for U.S. assets relative to British assets.
D) increase in U.S. interest rates relative to British interest rates.
E) decrease in British consumers' demand for U.S. goods.
Correct Answer:
Verified
Q41: A national government or central bank can
Q42: The following figure depicts the supply of
Q43: The following figure depicts the supply of
Q44: The following two figures depict the demand
Q46: The arrows in Figures A–D represent possible
Q48: The following two figures depict the demand
Q52: Figure A below depicts the demand and
Q53: The figure below depicts the three possible
Q57: The following two figures depict the demand
Q60: The arrows in Figures A–D represent possible
Unlock this Answer For Free Now!
View this answer and more for free by performing one of the following actions

Scan the QR code to install the App and get 2 free unlocks

Unlock quizzes for free by uploading documents