The following two figures depict the demand and supply of U.S. dollars and the demand and supply of British pounds in the foreign currency exchange market. Use these figures to answer the next questions.
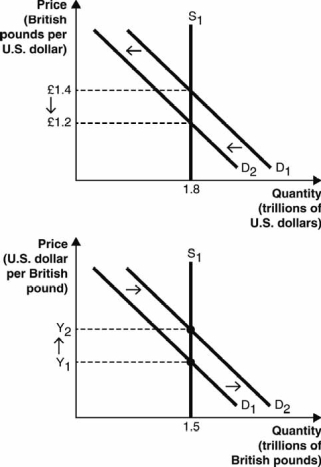
-Assume that the same event caused demand for U.S. dollars to decrease and demand for British pounds to increase and that both of these graphs describe that event. Approximately what is Y1 ?
A) $0.50
B) $0.71
C) $0.83
D) $1.20
E) $1.40
Correct Answer:
Verified
Q42: The following figure depicts the supply of
Q43: The following figure depicts the supply of
Q44: The following two figures depict the demand
Q46: The arrows in Figures A–D represent possible
Q51: The figure below depicts the supply of
Q52: Figure A below depicts the demand and
Q53: The following figure depicts the demand for
Q53: The figure below depicts the three possible
Q56: If interest rates in Australia decrease relative
Q60: The arrows in Figures A–D represent possible
Unlock this Answer For Free Now!
View this answer and more for free by performing one of the following actions

Scan the QR code to install the App and get 2 free unlocks

Unlock quizzes for free by uploading documents