The diagram below shows cost and revenue curves for a natural monopoly producing electricity. Price is dollars per kilowatt hour and quantity is kilowatt hours per day. 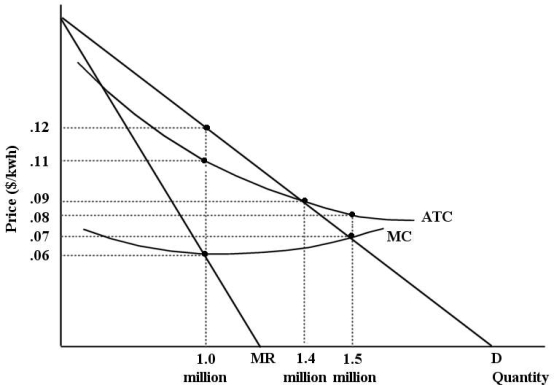 FIGURE 12- 7
-Refer to Figure 12- 7. Suppose this firm is being regulated using a policy of average- cost pricing. The resulting price and output would be per kwh and kwh per day.
A) $0.11; 1 million
B) $0.09; 1.4 million
C) $0.07; 1.5 million
D) $0.06; 1 million
E) $0.12; 1 million
Correct Answer:
Verified
Q68: The diagram below shows cost and revenue
Q69: Allocative efficiency concerns
A) the allocation of resources
Q70: Consider two firms, A and B, that
Q71: The production possibilities boundary shows possible combinations
Q72: The production possibilities boundary shows possible combinations
Q74: The diagram below shows the demand and
Q75: The diagram below shows supply, demand, and
Q76: One method of regulating a natural monopoly
Q77: A natural monopoly exists when
A) a firm
Q78: The diagram below shows supply, demand, and
Unlock this Answer For Free Now!
View this answer and more for free by performing one of the following actions

Scan the QR code to install the App and get 2 free unlocks

Unlock quizzes for free by uploading documents