In the following schematic diagrams of ethylene signaling in plants, 1 denotes ethylene, 2 denotes ethylene receptor, 3 denotes CTR1, 4 denotes EIN3, and 5 represents the expression of ethylene-responsive genes. Which diagram better depicts the signaling pathway? Activation and inhibition are indicated as normal and blunt arrows, respectively.
A) 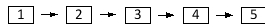
B) 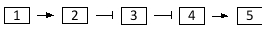
C) 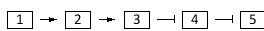
D) 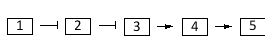
E) 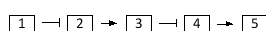
Correct Answer:
Verified
Q53: Indicate true (T) and false (F) statements
Q54: In the following diagram showing five parallel
Q55: Cancer-related genes can be classified into two
Q56: The SH2 domain of STAT proteins plays
Q57: Ethylene receptors in plant cells ...
A) are
Q58: Regulation of the Ci (Cubitus interruptus) protein
Q59: Which of the following represents the active
Q60: Which of the following mechanisms is NOT
Q61: Indicate whether each of the following descriptions
Q62: Arabidopsis thaliana seedlings show positive phototropism: they
Unlock this Answer For Free Now!
View this answer and more for free by performing one of the following actions

Scan the QR code to install the App and get 2 free unlocks

Unlock quizzes for free by uploading documents