Multiple Choice
Exhibit 3-3 Demand curves 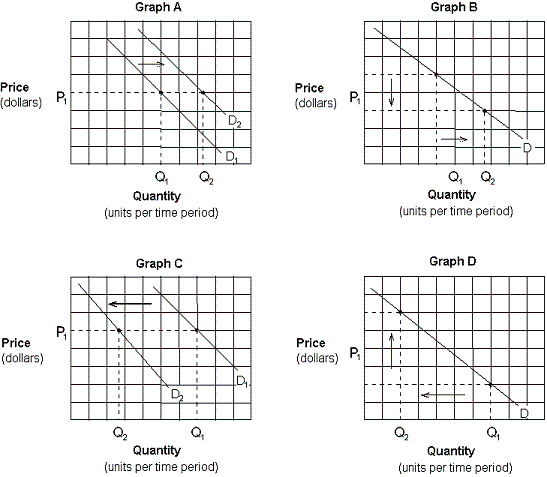 Which of the graphs in Exhibit 3-3 depicts the effect of a decrease in the price of pizza on the demand curve for pizza?
A) Graph A.
B) Graph B
C) Graph C.
D) Graph D.
Correct Answer:
Verified
Related Questions
Q65: In accordance with the law of supply,
Q68: Other things being equal, the effect of
Q155: Assume that crackers and soup are complementary
Q157: Two goods that are complementary are:
A) wrapping

