Multiple Choice
Exhibit 3-3 Demand curves 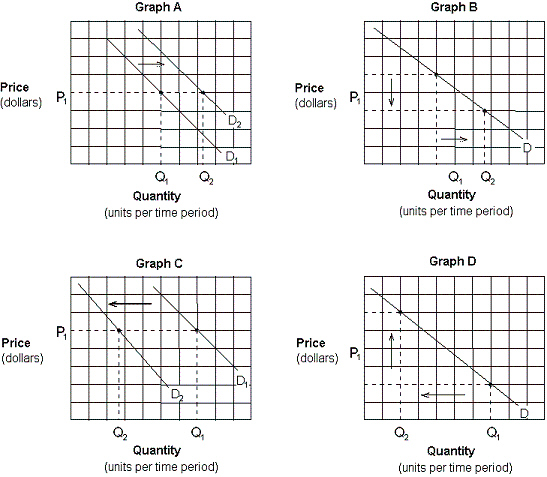 Which of the graphs in Exhibit 3-3 depicts the effect of an increase in income on the demand for pork and beans (an inferior good) ?
A) Graph A.
B) Graph B.
C) Graph C.
D) Graph D.
Correct Answer:
Verified
Related Questions
Q65: In accordance with the law of supply,
Q67: Supply curves slope upward because:
A) the quality
Q77: The law of supply states that:
A) there

