Multiple Choice
Exhibit 3-3 Demand curves 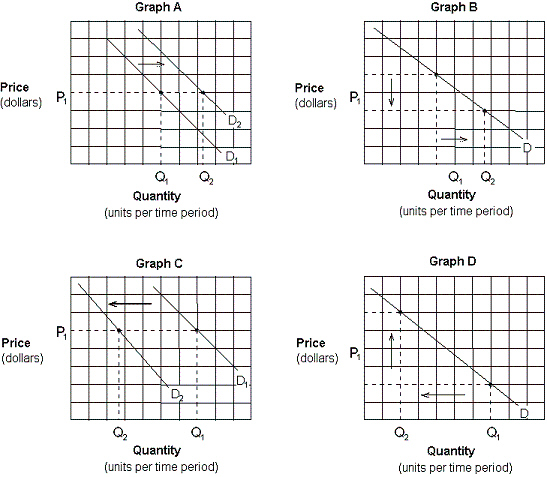 Assume that consumers expect the price of gasoline to rise sharply in the future. Which of the graphs in Exhibit 3-3 depicts this effect?
A) Graph A.
B) Graph B.
C) Graph C.
D) Graph D.
Correct Answer:
Verified
Related Questions
Q65: In accordance with the law of supply,
Q67: Supply curves slope upward because:
A) the quality
Q155: Assume that crackers and soup are complementary

