Exhibit 3-3 Demand curves 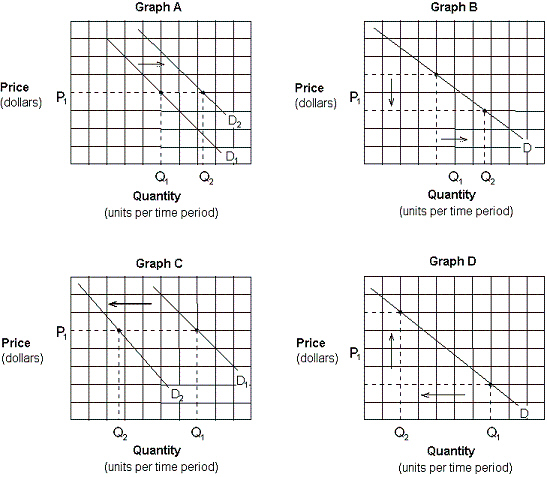 Assume that crackers and soup are complementary goods. Which of the graphs in Exhibit 3-3 depicts the effect of a promotional discount that decreases the price of crackers on the demand for soup?
A) Graph A.
B) Graph B.
C) Graph C.
D) Graph D.
Correct Answer:
Verified
Q65: In accordance with the law of supply,
Q68: Other things being equal, the effect of
Q141: Suppose that X and Y are complementary
Q145: Which of the following pairs of goods
Q155: Assume that crackers and soup are complementary
Q157: Two goods that are complementary are:
A) wrapping
Q163: Exhibit 3-3 Demand curves Q165: Exhibit 3-3 Demand curves Q166: Exhibit 3-3 Demand curves Q167: Complementary goods are goods: Unlock this Answer For Free Now! View this answer and more for free by performing one of the following actions Scan the QR code to install the App and get 2 free unlocks Unlock quizzes for free by uploading documents![]()
![]()
![]()
A) that are consumed

