Refer to the figure.
Figure 1
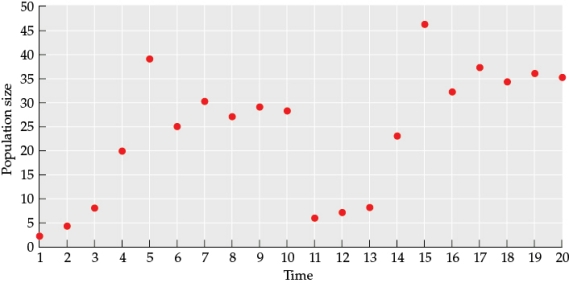 Use the data from the figure to draw a line graph (this will be referred to as Figure 2) that illustrates how population size changes over time. From time 1 to time 10, what type of logistic curve best fits this data? In your answer, address both the pattern of the line and the underlying cause of these patterns.
Correct Answer:
Verified
View Answer
Unlock this answer now
Get Access to more Verified Answers free of charge
Q41: Which statement about environmental stochasticity is true?
A)
Q42: A population of lions in the Ngorongoro
Q43: Which event did not contribute to the
Q44: Suppose you are studying two small lakes
Q45: Lionfish (Pterois spp.) arrived in the Caribbean
Q47: Refer to the figures.
Figure 1

Q48: Refer to the figures.
Figure 1
Q49: Refer to the figures.
Figure 1
Q50: Refer to the figures.
Figure 1
Q51: Refer to the figures.
Figure 1
Unlock this Answer For Free Now!
View this answer and more for free by performing one of the following actions

Scan the QR code to install the App and get 2 free unlocks

Unlock quizzes for free by uploading documents