Refer to the figures.
Figure 1
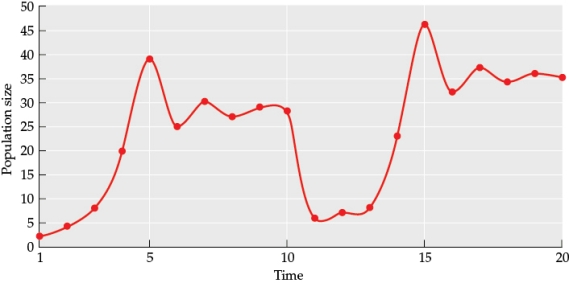
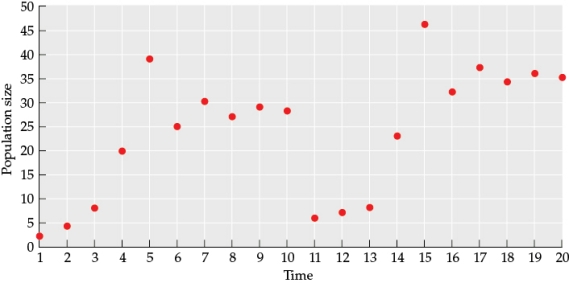 Figure 2
-What happened to the population between time 10 and 11? Based on the data prior to this point, what type of event most likely caused the change in the population size seen at that time? What additional data would you need to determine the underlying cause of the event?
Correct Answer:
Verified
View Answer
Unlock this answer now
Get Access to more Verified Answers free of charge
Q42: A population of lions in the Ngorongoro
Q43: Which event did not contribute to the
Q44: Suppose you are studying two small lakes
Q45: Lionfish (Pterois spp.) arrived in the Caribbean
Q46: Refer to the figure.
Figure 1

Q48: Refer to the figures.
Figure 1
Q49: Refer to the figures.
Figure 1
Q50: Refer to the figures.
Figure 1
Q51: Refer to the figures.
Figure 1
Q52: Refer to the figures.
Figure 2
Unlock this Answer For Free Now!
View this answer and more for free by performing one of the following actions

Scan the QR code to install the App and get 2 free unlocks

Unlock quizzes for free by uploading documents