Refer to the figures.
Figure 1
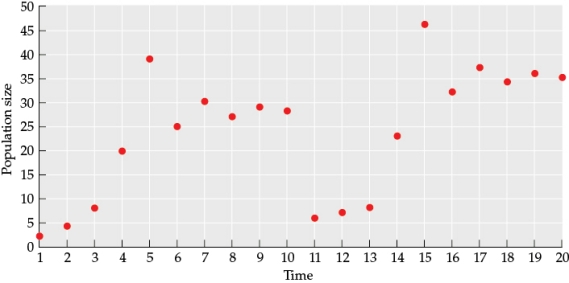 Figure 2
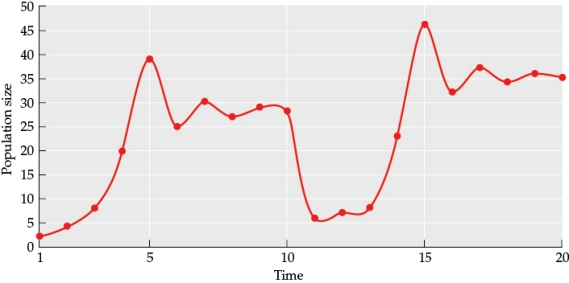
- What is the carrying capacity (K) of the population prior to the event that occurred between times 10 and 11? What is the carrying capacity after the event? Why is the carrying capacity different for these times? What could have caused this change?
Correct Answer:
Verified
View Answer
Unlock this answer now
Get Access to more Verified Answers free of charge
Q43: Which event did not contribute to the
Q44: Suppose you are studying two small lakes
Q45: Lionfish (Pterois spp.) arrived in the Caribbean
Q46: Refer to the figure.
Figure 1

Q47: Refer to the figures.
Figure 1
Q49: Refer to the figures.
Figure 1
Q50: Refer to the figures.
Figure 1
Q51: Refer to the figures.
Figure 1
Q52: Refer to the figures.
Figure 2
Q53: When wolves were returned to Yellowstone National
Unlock this Answer For Free Now!
View this answer and more for free by performing one of the following actions

Scan the QR code to install the App and get 2 free unlocks

Unlock quizzes for free by uploading documents