Refer to the figures.
Figure 1
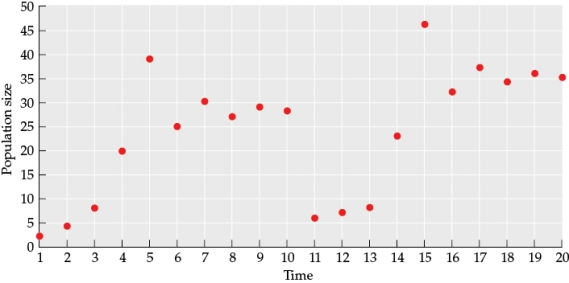 Figure 2
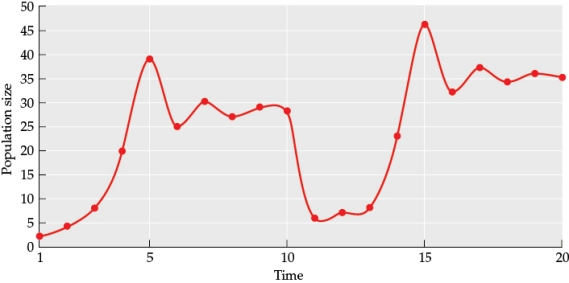 Figure 3
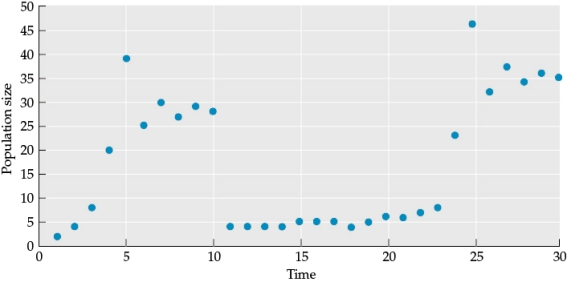 Suppose the population shows the pattern in Figure 3. Draw a new figure (this will be referred to as Figure 4) with a line that indicates how population size changed over time. What is the major difference between this pattern and the pattern in Figure 2? What are two factors that might be causing the pattern in Figure 4?
Correct Answer:
Verified
View Answer
Unlock this answer now
Get Access to more Verified Answers free of charge
Q46: Refer to the figure.
Figure 1

Q47: Refer to the figures.
Figure 1
Q48: Refer to the figures.
Figure 1
Q49: Refer to the figures.
Figure 1
Q50: Refer to the figures.
Figure 1
Q52: Refer to the figures.
Figure 2
Q53: When wolves were returned to Yellowstone National
Q54: Which statement about the Black Sea is
Q55: Eutrophication occurs when
A) there is a decrease
Q56: A population of rodents contained 703 individuals
Unlock this Answer For Free Now!
View this answer and more for free by performing one of the following actions

Scan the QR code to install the App and get 2 free unlocks

Unlock quizzes for free by uploading documents