Use the figure A Change in the Supply Curve. What caused the change shown in this graph?
Figure: A Change in the Supply Curve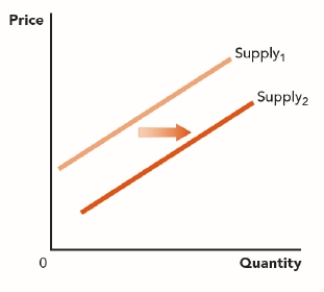
A) The price of a substitute in production increased.
B) The price of an input used to produce this good increased.
C) Sellers expect to get a lower price in the future.
D) Sellers are getting a lower price for a complement in production.
Correct Answer:
Verified
Q64: Ricotta and mozzarella are kinds of cheese.
Q65: An increase in the quantity supplied of
Q66: Good X and good Y are substitutes
Q67: When the number of firms in an
Q68: The supply curve does NOT shift to
Q70: Use the figure A Change in the
Q71: Use the figure A Change in the
Q72: Use the figure A Change in the
Q73: Use the figure A Change in the
Q74: Use the figure A Change in the
Unlock this Answer For Free Now!
View this answer and more for free by performing one of the following actions

Scan the QR code to install the App and get 2 free unlocks

Unlock quizzes for free by uploading documents