Use the figure A Change in the Supply Curve II. What caused the change shown in this graph?
Figure: A Change in the Supply Curve II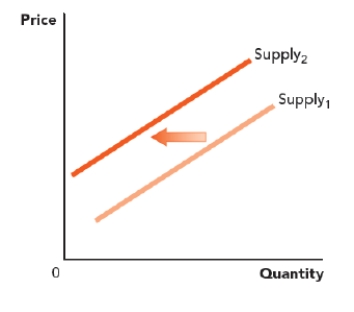
A) Consumer incomes increased.
B) The prices of the resources used to produce this good have gotten cheaper.
C) There are more firms in this market.
D) The price of a substitute in production to this good increased.
Correct Answer:
Verified
Q67: When the number of firms in an
Q68: The supply curve does NOT shift to
Q69: Use the figure A Change in the
Q70: Use the figure A Change in the
Q71: Use the figure A Change in the
Q73: Use the figure A Change in the
Q74: Use the figure A Change in the
Q75: What is producer surplus?
A) another name for
Q76: The difference between the price received from
Q77: When a good is sold, producer surplus
Unlock this Answer For Free Now!
View this answer and more for free by performing one of the following actions

Scan the QR code to install the App and get 2 free unlocks

Unlock quizzes for free by uploading documents