Use the figure A Change in the Supply Curve. What change has occurred in this graph?
Figure: A Change in the Supply Curve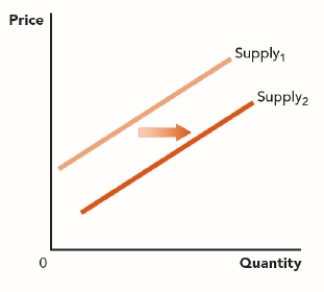
A) an increase in supply
B) an increase in quantity supplied
C) a decrease in supply
D) a decrease in quantity supplied
Correct Answer:
Verified
Q66: Good X and good Y are substitutes
Q67: When the number of firms in an
Q68: The supply curve does NOT shift to
Q69: Use the figure A Change in the
Q70: Use the figure A Change in the
Q72: Use the figure A Change in the
Q73: Use the figure A Change in the
Q74: Use the figure A Change in the
Q75: What is producer surplus?
A) another name for
Q76: The difference between the price received from
Unlock this Answer For Free Now!
View this answer and more for free by performing one of the following actions

Scan the QR code to install the App and get 2 free unlocks

Unlock quizzes for free by uploading documents