Use the figure A Change in the Supply Curve II. What could have caused the change shown here?
Figure: A Change in the Supply Curve II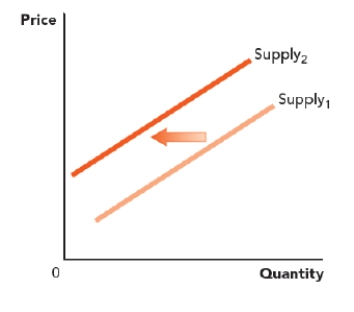
A) The price of a complement in production of this good decreased.
B) The number of buyers increased.
C) The cost of resources decreased.
D) Consumer incomes increased, and this is a normal good.
Correct Answer:
Verified
Q68: The supply curve does NOT shift to
Q69: Use the figure A Change in the
Q70: Use the figure A Change in the
Q71: Use the figure A Change in the
Q72: Use the figure A Change in the
Q74: Use the figure A Change in the
Q75: What is producer surplus?
A) another name for
Q76: The difference between the price received from
Q77: When a good is sold, producer surplus
Q78: The supply of cheese sticks is upward
Unlock this Answer For Free Now!
View this answer and more for free by performing one of the following actions

Scan the QR code to install the App and get 2 free unlocks

Unlock quizzes for free by uploading documents