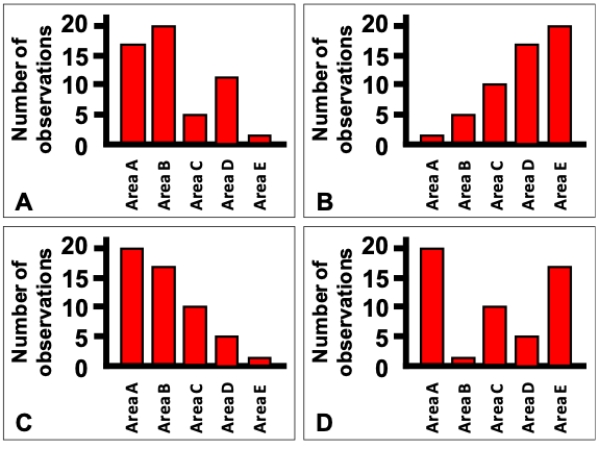
Which of the bar charts shown corresponds to the data table shown?
?
Frequency table showing the number of oak trees in each of 5 areas in a forest.
? ?
?
A) Chart A
B) Chart B
C) Chart C
D) Chart D
Correct Answer:
Verified
Q4: Consider an experiment in which female and
Q5: Consider an experiment in which female and
Q6: The type of figure that uses rectangles,
Q7: Which of the following is NOT true
Q8: Which of the following would greatly
Q10: Consider an experiment in which an omnivorous
Q11: Consider an experiment in which an omnivorous
Q12: Consider a lake survey in which the
Q13: Consider a lake survey in which the
Q14: Consider a lake survey in which the
Unlock this Answer For Free Now!
View this answer and more for free by performing one of the following actions

Scan the QR code to install the App and get 2 free unlocks

Unlock quizzes for free by uploading documents