Consider a lake survey in which the relative amounts of five different types of fish are identified. Which of the following data sets matches the pie chart shown?
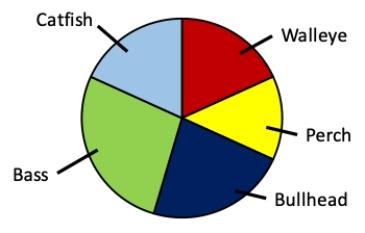
A) 25% bass, 20% bullhead, 25% catfish, 15% perch, 15% walleye
B) 35% bass, 15% bullhead, 15% catfish, 15% perch, 20% walleye
C) 20% bass, 15% bullhead, 25% catfish, 20% perch, 20% walleye
D) 30% bass, 20% bullhead, 15% catfish, 15% perch, 20% walleye
Correct Answer:
Verified
Q7: Which of the following is NOT true
Q8: Which of the following would greatly
Q9: Which of the bar charts shown
Q10: Consider an experiment in which an omnivorous
Q11: Consider an experiment in which an omnivorous
Q13: Consider a lake survey in which the
Q14: Consider a lake survey in which the
Q15: Consider the data table that indicates
Q16: Consider the data table that indicates
Q17: When designing a bar graph, which of
Unlock this Answer For Free Now!
View this answer and more for free by performing one of the following actions

Scan the QR code to install the App and get 2 free unlocks

Unlock quizzes for free by uploading documents