Consider a lake survey in which the relative amounts of five different types of fish are identified. Which of the following is not an aspect of poor design in the pie chart shown?
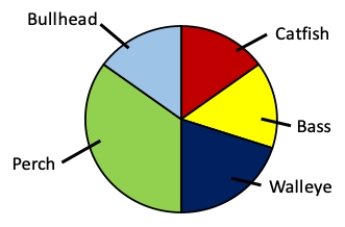
A) The segments are not arranged alphabetically.
B) The segments are not arranged in order of magnitude.
C) The green and light blue would be hard to tell apart if printed in black and white.
D) The yellow and red segments would be hard for most color-blind people to tell apart.
Correct Answer:
Verified
Q9: Which of the bar charts shown
Q10: Consider an experiment in which an omnivorous
Q11: Consider an experiment in which an omnivorous
Q12: Consider a lake survey in which the
Q13: Consider a lake survey in which the
Q15: Consider the data table that indicates
Q16: Consider the data table that indicates
Q17: When designing a bar graph, which of
Q18: Which of the following is generally true
Q19: If you saw a graph with rectangles
Unlock this Answer For Free Now!
View this answer and more for free by performing one of the following actions

Scan the QR code to install the App and get 2 free unlocks

Unlock quizzes for free by uploading documents