Consider an experiment in which an omnivorous species has its stomach contents analyzed. Which of the pie charts correctly depicts the following values for the diet of the omnivore: 20% grass, 40% leaves, 20% insects, 20% fish?
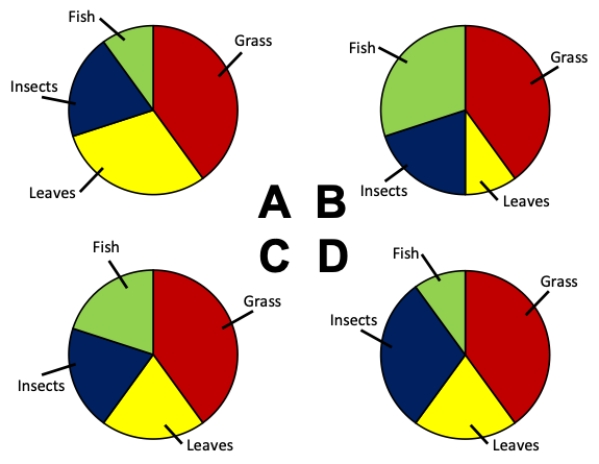
A) Chart A
B) Chart B
C) Chart C
D) Chart D
Correct Answer:
Verified
Q6: The type of figure that uses rectangles,
Q7: Which of the following is NOT true
Q8: Which of the following would greatly
Q9: Which of the bar charts shown
Q10: Consider an experiment in which an omnivorous
Q12: Consider a lake survey in which the
Q13: Consider a lake survey in which the
Q14: Consider a lake survey in which the
Q15: Consider the data table that indicates
Q16: Consider the data table that indicates
Unlock this Answer For Free Now!
View this answer and more for free by performing one of the following actions

Scan the QR code to install the App and get 2 free unlocks

Unlock quizzes for free by uploading documents