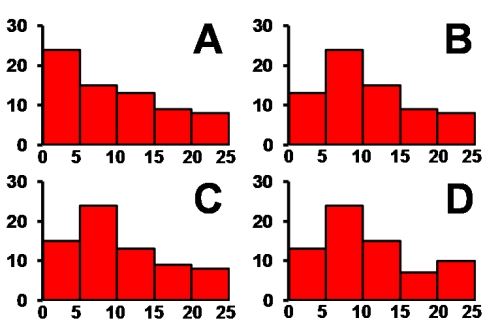
Consider the data table that indicates how many subjects in a skin cancer study had various sizes of moles on their backs. Which of the histograms correctly depicts the data?
Frequency table showing the average size of moles on 70 subjects.
 ?
?
?
A) Chart A
B) Chart B
C) Chart C
D) Chart D
Correct Answer:
Verified
Q11: Consider an experiment in which an omnivorous
Q12: Consider a lake survey in which the
Q13: Consider a lake survey in which the
Q14: Consider a lake survey in which the
Q15: Consider the data table that indicates
Q17: When designing a bar graph, which of
Q18: Which of the following is generally true
Q19: If you saw a graph with rectangles
Q20: If you saw a graph with rectangles
Q21: Consider the histogram of a data set
Unlock this Answer For Free Now!
View this answer and more for free by performing one of the following actions

Scan the QR code to install the App and get 2 free unlocks

Unlock quizzes for free by uploading documents