The following dotplot shows migraine intensity (on a scale of 1 to 10) for 29 adults suffering from recurring migraines.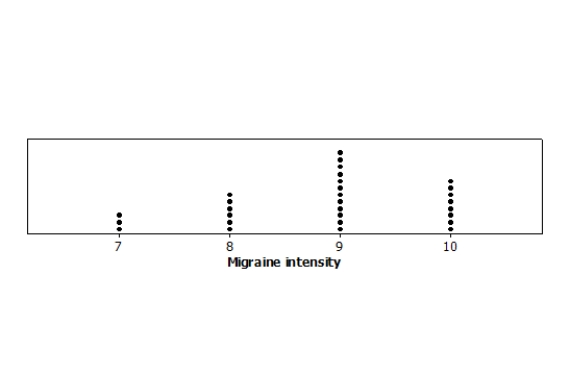 What is the best description of this distribution?
A) Symmetric with 3 outliers
B) Moderately left-skewed
C) Moderately right-skewed
D) Multimodal
Correct Answer:
Verified
Q23: The estimated annual number of smoking-attributable
Q24: The estimated annual number of smoking-attributable
Q25: The following histogram shows body temperatures (in
Q26: The following histogram shows body temperatures (in
Q27: A sample of 40 endangered species was
Q29: The following histogram depicts the prevalence rates
Q30: The following histogram shows the yearly number
Q31: The following histogram shows the yearly number
Q32: The following graph shows the percent of
Q33: Opioid pain relievers are prescribed at a
Unlock this Answer For Free Now!
View this answer and more for free by performing one of the following actions

Scan the QR code to install the App and get 2 free unlocks

Unlock quizzes for free by uploading documents