The following histogram shows body temperatures (in degrees Fahrenheit) for 65 healthy adult women.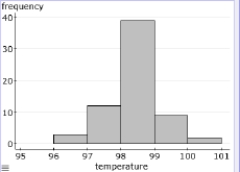 What is the best description of this distribution?
A) Roughly symmetric
B) Bimodal
C) Clearly right-skewed
D) Clearly left-skewed
Correct Answer:
Verified
Q20: The following table shows the percent
Q21: The following graph shows the percent of
Q22: The following graph shows the percent of
Q23: The estimated annual number of smoking-attributable
Q24: The estimated annual number of smoking-attributable
Q26: The following histogram shows body temperatures (in
Q27: A sample of 40 endangered species was
Q28: The following dotplot shows migraine intensity (on
Q29: The following histogram depicts the prevalence rates
Q30: The following histogram shows the yearly number
Unlock this Answer For Free Now!
View this answer and more for free by performing one of the following actions

Scan the QR code to install the App and get 2 free unlocks

Unlock quizzes for free by uploading documents