Multiple Choice
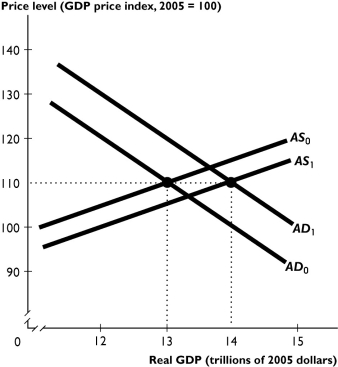
The figure above shows an economy aggregate demand curve and aggregate supply curves.
-Suppose the shift from AD₀ to AD₁ and from AS₀ to AS₁ is the result of fiscal policy.Which of the policies below could lead to these shifts?
i. An increase in government expenditure
ii. A tax cut
iii. A decrease in government expenditure
iv. A tax hike
A) i only
B) iv only
C) i and ii
D) iii and iv
E) i and iv
Correct Answer:
Verified
Related Questions

