The table given below reports the quantity of bread loaves demanded and supplied at different per unit prices.
Table 3.3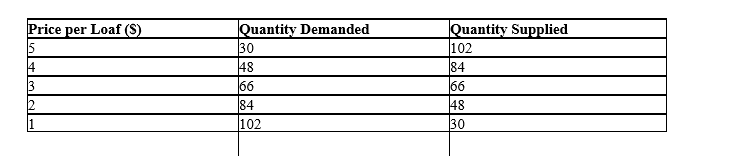
-Refer to Table 3.3.Which of the following would occur in the market for bread if the market price exceeded the equilibrium price by $1?
A) The quantity of bread demanded in the market would increase
B) The bread market would face a surplus of 36 loaves of bread
C) The supply of bread in the market would increase
D) The bread market would face a shortage of 72 loaves of bread
E) The demand for bread in the market would decrease
Correct Answer:
Verified
Q8: The figure given below represents the PPC
Q24: The table given below reports the quantity
Q27: The table given below reports the quantity
Q38: The table given below reports the quantity
Q39: Consider a demand curve for peaches.Which of
Q40: Which of the following will have no
Q42: The table given below reports the quantity
Q43: The figure given below represents the equilibrium
Q45: In the figure given below D1 and
Q58: In the figure given below, D1 and
Unlock this Answer For Free Now!
View this answer and more for free by performing one of the following actions

Scan the QR code to install the App and get 2 free unlocks

Unlock quizzes for free by uploading documents