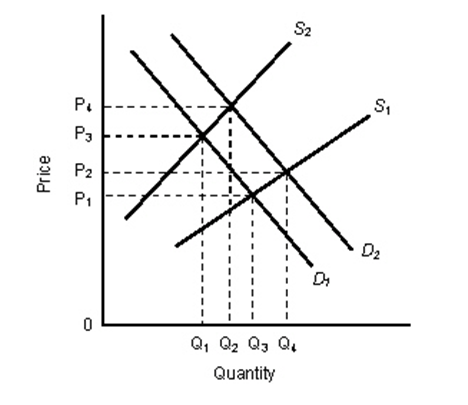
In the figure given below D1 and S1 are the initial demand and supply curves for a commodity in the market. Figure 3.3
-Refer to Figure 3.3.If the change in the demand in this market occurred before the change in supply,then starting from the initial equilibrium:
A) firms would experience a fall in profits and then a gradual increase in profits after the change in supply occurred.
B) there would be an immediate shortage,lasting until the price reaches P2.
C) price would change from P1 to P2 after the change in demand and would change again from P3 to P4 after the change in supply.
D) there would be a surplus until the price reaches P4.
E) there would be a surplus even after price reaches P4.
Correct Answer:
Verified
Q24: The table given below reports the quantity
Q40: Which of the following will have no
Q41: The table given below reports the quantity
Q42: The table given below reports the quantity
Q43: The figure given below represents the equilibrium
Q47: Assume that Ford Motor Company engineers achieve
Q48: The below figure shows the demand and
Q49: The below figure shows the demand and
Q53: The table given below represents the supply
Q58: In the figure given below, D1 and
Unlock this Answer For Free Now!
View this answer and more for free by performing one of the following actions

Scan the QR code to install the App and get 2 free unlocks

Unlock quizzes for free by uploading documents