The figure given below represents the equilibrium in the market for bicycles under different demand and supply situations.The vertical axis in each panel shows the price of bikes. Figure 3.2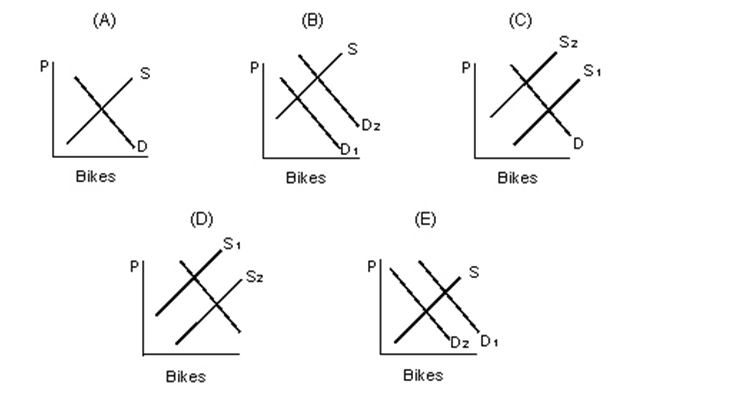
-Refer to Figure 3.2.Which of the following panels represents the equilibrium situation in the bicycle market,if there were an increase in the price of metal used in the production of bicycles?
A) Panel A
B) Panel B
C) Panel C
D) Panel D
E) Panel E
Correct Answer:
Verified
Q8: The figure given below represents the PPC
Q24: The table given below reports the quantity
Q39: Consider a demand curve for peaches.Which of
Q40: Which of the following will have no
Q41: The table given below reports the quantity
Q42: The table given below reports the quantity
Q45: In the figure given below D1 and
Q47: Assume that Ford Motor Company engineers achieve
Q48: The below figure shows the demand and
Q58: In the figure given below, D1 and
Unlock this Answer For Free Now!
View this answer and more for free by performing one of the following actions

Scan the QR code to install the App and get 2 free unlocks

Unlock quizzes for free by uploading documents