The table given below reports the quantity demanded and supplied of a commodity in a market at different price levels.
Table 3.4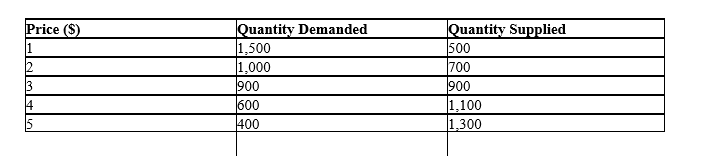
-Refer to Table 3.4.In the market represented by this table,at equilibrium:
A) the market price is $5 per unit.
B) there is a surplus of 900 units.
C) there is a shortage of 900 units.
D) 900 units are traded at a price of $3 per unit.
E) the market price is $1 per unit and the quantity traded is 500 units.
Correct Answer:
Verified
Q8: The figure given below represents the PPC
Q24: The table given below reports the quantity
Q27: The table given below reports the quantity
Q39: Consider a demand curve for peaches.Which of
Q40: Which of the following will have no
Q41: The table given below reports the quantity
Q43: The figure given below represents the equilibrium
Q45: In the figure given below D1 and
Q47: Assume that Ford Motor Company engineers achieve
Q58: In the figure given below, D1 and
Unlock this Answer For Free Now!
View this answer and more for free by performing one of the following actions

Scan the QR code to install the App and get 2 free unlocks

Unlock quizzes for free by uploading documents