FIGURE 8-20 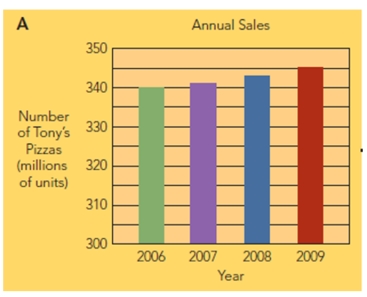
-Figure 8-22 above shows that
A) Tony's Pizza sales to households with 5 or more people increased over the period 2006 to 2009.
B) households with 5 or more people bought the least Tony's Pizza over the period 2006 to 2009.
C) between 2006 to 2007, as single people married and became two person households, the increase in sales was greater than the expected 200% change.
D) Tony's Pizza sales to households with 2 people have remained relatively steady from 2006 to 2009.
E) the changes from year to year are really not significant since overall sales have continued to increase.
Correct Answer:
Verified
Q215: Marketing teams must be vigilant for ways
Q216: The total sales of a product that
Q217: A(n) _ is a type of forecast
Q218: A salesforce survey forecast involves
A)asking prospective customers
Q219: Evaluating the results of a marketing decision
Q223: To assist clients such as Tony's in
Q224: The raw data that Ford Consulting Group
Q225: Good marketing research requires great care especially
Q281: What is data mining, and why is
Q310: What is a panel? How is it
Unlock this Answer For Free Now!
View this answer and more for free by performing one of the following actions

Scan the QR code to install the App and get 2 free unlocks

Unlock quizzes for free by uploading documents