FIGURE 8-23 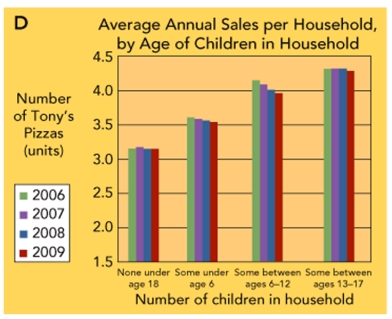
-Figure 8-23 above shows that
A) Tony's Pizza sales to households with some children between the age of 13 and 17 decreased significantly over the period 2006-2009.
B) Tony's Pizza sales to households with children between the ages of 6 to 12 decreased over the period 2006-2009.
C) Tony's Pizza sales to single-person households have remained relatively steady from 2006-2009.
D) Tony's Pizza sales to households with no children under 18 have declined from 2006-2009.
E) there is not a significant enough difference between age groups that would warrant a marketing action at this time.
Correct Answer:
Verified
Q198: When conducting marketing experiments, the independent variable
Q199: Red Carpet Baby!, a children's accessory and
Q200: A potential difficulty with an experiment is
Q201: Lost-horse forecasting involves
A)admitting that the actions you
Q202: Sales forecast refers to
A)the total sales of
Q204: Trend extrapolation involves
A)extending a pattern observed in
Q205: Making action recommendations, implementing action recommendation, and
Q206: FIGURE 8-20 Q207: What percentage of sales forecasts are made Q208: FIGURE 8-24 ![]()
![]()
Unlock this Answer For Free Now!
View this answer and more for free by performing one of the following actions

Scan the QR code to install the App and get 2 free unlocks

Unlock quizzes for free by uploading documents