FIGURE 8-20 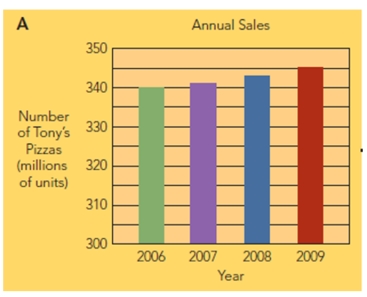
-Figure 8-21 above shows that
A) annual sales of Tony's Pizzas decreased over the period 2006 to 2009.
B) average annual sales per household of Tony's Pizzas decreased over the period 2006 to 2009.
C) average sales have dropped from 3.4 million to 3.1 million units.
D) sales to households with children declined over the period 2006 to 2009.
E) smaller households bought less pizza over the period 2006 to 2009.
Correct Answer:
Verified
Q201: Lost-horse forecasting involves
A)admitting that the actions you
Q202: Sales forecast refers to
A)the total sales of
Q203: FIGURE 8-23 Q204: Trend extrapolation involves Q205: Making action recommendations, implementing action recommendation, and Q207: What percentage of sales forecasts are made![]()
A)extending a pattern observed in
Unlock this Answer For Free Now!
View this answer and more for free by performing one of the following actions

Scan the QR code to install the App and get 2 free unlocks

Unlock quizzes for free by uploading documents