FIGURE 8-24 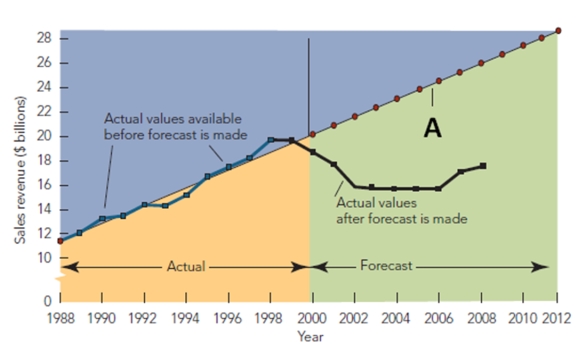
-Figure 8-24 above, is an example of what type of statistical forecasting?
A) causal analysis.
B) non -parametric regression.
C) location parameter.
D) infinite dimension.
E) linear trend extrapolation.
Correct Answer:
Verified
Q203: FIGURE 8-23 Q204: Trend extrapolation involves Q205: Making action recommendations, implementing action recommendation, and Q206: FIGURE 8-20 Q207: What percentage of sales forecasts are made Q209: A(n) _ forecast involves starting with the Q210: The final stage in the five-step marketing Q211: A survey of buyer' intentions forecast involves Q212: A direct forecast involves estimating the value Q213: FIGURE 8-24 Unlock this Answer For Free Now! View this answer and more for free by performing one of the following actions Scan the QR code to install the App and get 2 free unlocks Unlock quizzes for free by uploading documents![]()
A)extending a pattern observed in![]()
A)starting![]()

