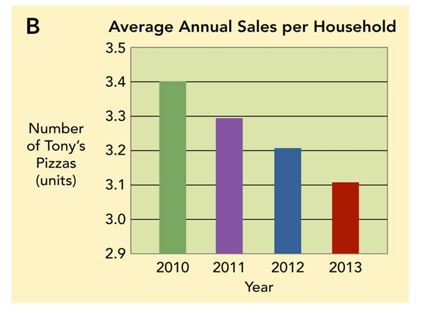
-Figure 7-6B above shows that
A) annual sales of Tony's Pizza increased over the period 2010 and 2013.
B) average annual unit sales of Tony's Pizza per household decreased over the period 2010 and 2013.
C) average dollar sales of Tony's Pizza have dropped from $3.4 million to $3.1 million.
D) sales of Tony's Pizza to households with children declined over the period 2010 and 2013.
E) smaller households bought less Tony's Pizza over the period 2010 and 2013.
Correct Answer:
Verified
Q243: The two aspects of the process for
Q249: Linear trend extrapolation is a form of
Q252: Q253: Q259: Three frequently used sales forecasting techniques are: Q264: A(n)_ is a type of forecast that Q269: In trend extrapolation, the forecasting technique that Q272: A sales forecast refers to Q273: The final step in the five-step marketing Q297: Lost-horse forecasting involves![]()
![]()
A)the total sales
A)admitting that the actions you
Unlock this Answer For Free Now!
View this answer and more for free by performing one of the following actions

Scan the QR code to install the App and get 2 free unlocks

Unlock quizzes for free by uploading documents