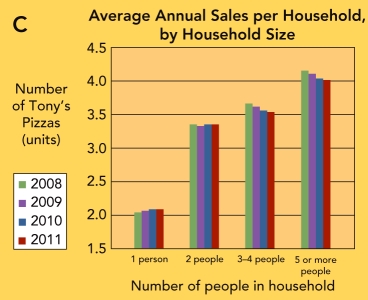
 Figure 8-6C: Average Annual Sales per Household of Tony's Pizza, by Household Size
-Figure 8-6C above shows that
A) Tony's Pizza sales to households with 5 or more people increased over the period 2008 to 2011.
B) households with 5 or more people bought the least amount of Tony's Pizza over the period 2008 to 2011.
C) from 2008 to 2011, as single people married and became two person households, the increase in sales of Tony's Pizza was greater than the expected 200% change.
D) Tony's Pizza sales to households with 2 people have remained relatively steady from 2008 to 2011.
E) the changes from year to year are really not significant since overall sales of Tony's Pizza have continued to increase.
Correct Answer:
Verified
Q251: two aspects of the process for evaluating
Q252: Making action recommendations,implementing action recommendations,and evaluating results
Q253: Q254: consumers often buy soft drinks and potato Q255: Marketing teams must be vigilant in looking Q257: Evaluating the results of a marketing decision Q258: total sales of a product that a![]()
Unlock this Answer For Free Now!
View this answer and more for free by performing one of the following actions

Scan the QR code to install the App and get 2 free unlocks

Unlock quizzes for free by uploading documents