 Figure 8-6D: Average Annual Sales per Household of Tony's Pizza,
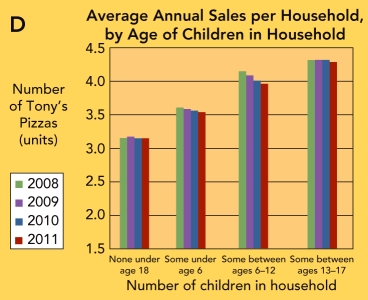
by Age of Children in Household
-Figure 8-6D above shows that
A) Tony's Pizza sales to households with some children between the ages of 13 to 17 decreased significantly over the period 2008 to 2011.
B) Tony's Pizza unit sales to households with children between the ages of 6 to 12 decreased over the period 2008 to 2011.
C) Tony's Pizza sales to single-person households have remained relatively steady from 2008 to 2011.
D) Tony's Pizza sales to households with no children under 18 have declined from 2008 to 2011.
E) there is not a significant enough difference between age groups that would warrant a marketing action at this time.
Correct Answer:
Verified
Q255: Marketing teams must be vigilant in looking
Q256: Q257: Evaluating the results of a marketing decision Q258: total sales of a product that a Q262: and describe the three main kinds of Q263: conducting marketing research on Facebook for Carmex,Jeff![]()
Unlock this Answer For Free Now!
View this answer and more for free by performing one of the following actions

Scan the QR code to install the App and get 2 free unlocks

Unlock quizzes for free by uploading documents