Refer to the figure below. 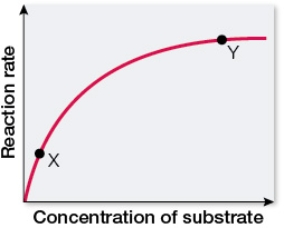 The graph was constructed from reaction-rate data collected using a constant amount of purified enzyme and increasing concentrations of substrate.Under conditions at point X, the graph indicates that the reaction rate changed dramatically when just a small increase in substrate concentration was made.Under conditions at point Y, the reaction rate changed very little with the same increase in substrate concentration.Explain why.
Correct Answer:
Verified
View Answer
Unlock this answer now
Get Access to more Verified Answers free of charge
Q135: The synthesis of the enzyme lipase would
Q136: The ΔG of a reaction is dependent
Q137: Refer to the table below. 
Q138: When potatoes are peeled, the enzyme
Q139: Refer to the figure below.
Q141: The hydrolysis of sucrose into glucose
Q142: Refer to the table below listing facts
Q143: The energy currency of cells is
A) light.
B)
Q144: Where is the chemical energy that is
Q145: In order to measure the standard
Unlock this Answer For Free Now!
View this answer and more for free by performing one of the following actions

Scan the QR code to install the App and get 2 free unlocks

Unlock quizzes for free by uploading documents