The following chart plots the cumulative number of defects opened against the cumulative number of defects closed during system testing of a software product. 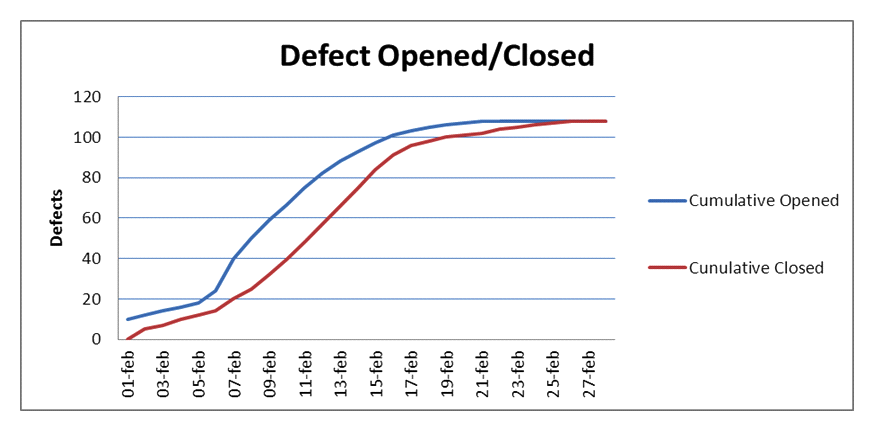 Which of the following statements is true? Number of correct responses: 1
A) The chart indicates that you have plenty of problems left to find
B) The chart can be used to reveal test progress problems
C) The chart seems to indicate that the defect management process is not working well
D) The chart seems to indicate that the defect management process is working well
Correct Answer:
Verified
Q8: The following are the exit criteria described
Q9: You are following a risk-based testing strategy.
Q10: You are the Test Manager of a
Q11: Assume that no additional product risks have
Q12: You are the Test Manager of a
Q14: Which of the following statements represents the
Q15: Assume you are working on a defect
Q16: Which of the following information would you
Q17: Which of the following is an example
Q18: Which of the following factors could negatively
Unlock this Answer For Free Now!
View this answer and more for free by performing one of the following actions

Scan the QR code to install the App and get 2 free unlocks

Unlock quizzes for free by uploading documents