(Figure: Peak-Load Pricing Model) The graph represents the market for a good that follows a peak-load pricing model. Which curve represents demand during a nonpeak period?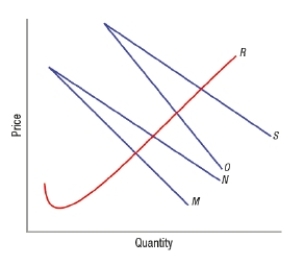
A) M
B) N
C) O
D) S
Correct Answer:
Verified
Q124: Cable customers often have to purchase ESPN,
Q125: Telecommunications customers are often given discounts for
Q126: Versioning is a type of
A) bundling.
B) intertemporal
Q127: Versioning is a type of _, which
Q128: (Figure: Peak-Load Pricing Model) The graph represents
Q130: (Figure: Peak-Load Pricing Model) The graph represents
Q131: The Apple Watch was released in the
Q132: Which of these is an example of
Q133: Yummy Yogurt offers a free medium serving
Q134: Which of these is an example of
Unlock this Answer For Free Now!
View this answer and more for free by performing one of the following actions

Scan the QR code to install the App and get 2 free unlocks

Unlock quizzes for free by uploading documents