The scatterplot below displays the total home attendance (in millions) for major league baseball's National League for the years 1960 through 2002.This total home attendance is the grand total of all attendees at all National League games during the season.For what range of years is a linear model appropriate? 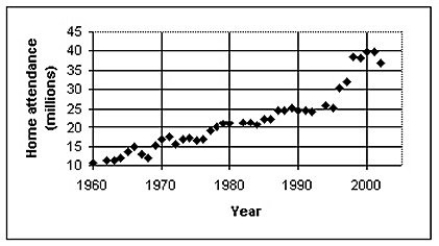
A) A linear model should not be used for any part of the data set.
B) A single linear model is appropriate for the entire data set.
C) One linear model is appropriate for 1960 through 1995 and another linear model for 1995 through 2002.
D) A linear model should be used for each pair of adjacent data points.
E) None of these
Correct Answer:
Verified
Q1: The table below shows the gestation
Q2: The total home-game attendance for major-league
Q3: The scatterplot below shows the percentage of
Q5: Which of the following scatterplots of residuals
Q6: The data in the table below
Q7: Which of the following scatterplots of residuals
Q8: Which of the labeled points below will
Q9: Which of the labeled points below are
Q10: Which of the following scatterplots of residuals
Q11: The scatterplot below displays world population (in
Unlock this Answer For Free Now!
View this answer and more for free by performing one of the following actions

Scan the QR code to install the App and get 2 free unlocks

Unlock quizzes for free by uploading documents