The table below shows the gestation (in days) and average longevity (in years) for a number of different mammals: The scatter plot and regression equation are shown below: 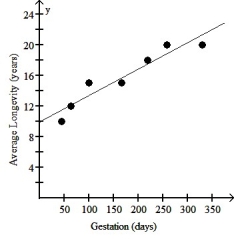 The regression analysis of this data yields the following values: R2 = 0.9048 Use this model to predict the average longevity of an African elephant whose gestation is 660 days.
A) 32.7 years
B) 38.7 years
C) 41.9 years
D) 22.8 years
E) 51.2 years
Correct Answer:
Verified
Q2: The total home-game attendance for major-league
Q3: The scatterplot below shows the percentage of
Q4: The scatterplot below displays the total home
Q5: Which of the following scatterplots of residuals
Q6: The data in the table below
Q7: Which of the following scatterplots of residuals
Q8: Which of the labeled points below will
Q9: Which of the labeled points below are
Q10: Which of the following scatterplots of residuals
Q11: The scatterplot below displays world population (in
Unlock this Answer For Free Now!
View this answer and more for free by performing one of the following actions

Scan the QR code to install the App and get 2 free unlocks

Unlock quizzes for free by uploading documents