The scatterplot below shows the percentage of the US population that is foreign born for the years 1910 - 1990.For what range of years is a linear model appropriate? 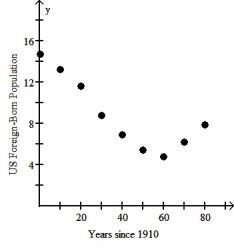
A) One linear model is appropriate for the years 1910 through 1950 and another linear model for the years 1950 through 1990.
B) A linear model should be used for each pair of adjacent data points.
C) One linear model is appropriate for the years 1910 through 1970 and another linear model for the years 1970 through 1990.
D) A linear model should not be used for any part of the data.
E) A single linear model is appropriate for the entire data set.
Correct Answer:
Verified
Q1: The table below shows the gestation
Q2: The total home-game attendance for major-league
Q4: The scatterplot below displays the total home
Q5: Which of the following scatterplots of residuals
Q6: The data in the table below
Q7: Which of the following scatterplots of residuals
Q8: Which of the labeled points below will
Q9: Which of the labeled points below are
Q10: Which of the following scatterplots of residuals
Q11: The scatterplot below displays world population (in
Unlock this Answer For Free Now!
View this answer and more for free by performing one of the following actions

Scan the QR code to install the App and get 2 free unlocks

Unlock quizzes for free by uploading documents