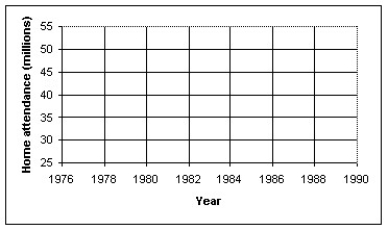
The total home-game attendance for major-league baseball is the sum of all attendees for all stadiums during the entire season.The home attendance (in millions)for a number of years is shown in the table below. a)Make a scatterplot showing the trend in home attendance.Describe what you see.  b)Determine the correlation,and comment on its significance.
c)Find the equation of the line of regression.Interpret the slope of the equation.
d)Use your model to predict the home attendance for 1998.How much confidence do you have in this prediction? Explain.
e)Use the internet or other resource to find reasons for any outliers you observe in the scatterplot.
Correct Answer:
Verified
Q1: The table below shows the gestation
Q3: The scatterplot below shows the percentage of
Q4: The scatterplot below displays the total home
Q5: Which of the following scatterplots of residuals
Q6: The data in the table below
Q7: Which of the following scatterplots of residuals
Q8: Which of the labeled points below will
Q9: Which of the labeled points below are
Q10: Which of the following scatterplots of residuals
Q11: The scatterplot below displays world population (in
Unlock this Answer For Free Now!
View this answer and more for free by performing one of the following actions

Scan the QR code to install the App and get 2 free unlocks

Unlock quizzes for free by uploading documents