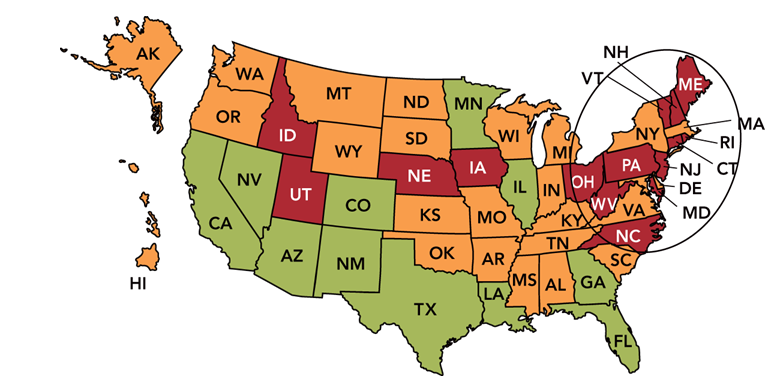
-N the Marketing Dashboard Map above,the annual growth rate in each state is shown,with green meaning good and red meaning very bad.If an organization's 2012 sales for the entire U.S.were $50 million and its 2011 U.S.sales were $30 million,what is the annual % sales change?
A) 33%
B) 67%
C) 100%
D) 125%
E) 133%
Correct Answer:
Verified
Q213: One of the eight primary MARKETING-RELATED reasons
Q214: When General Mills introduced Fingos,a corn chip-sized
Q218: If you are using a marketing dashboard
Q220: Developing a pool of concepts as candidates
Q223: The first stage of the new-product process
Q243: Which stage in the new-product process has
Q246: All of the following are sources for
Q248: The stage of the new-product process that
Q249: Open innovation may enhance the _ stage
Q259: Many forward-looking companies have discovered that their
Unlock this Answer For Free Now!
View this answer and more for free by performing one of the following actions

Scan the QR code to install the App and get 2 free unlocks

Unlock quizzes for free by uploading documents